
 STREAMING & SOCIAL ANALYTICS
Streaming Analytics Built for Label Catalogs
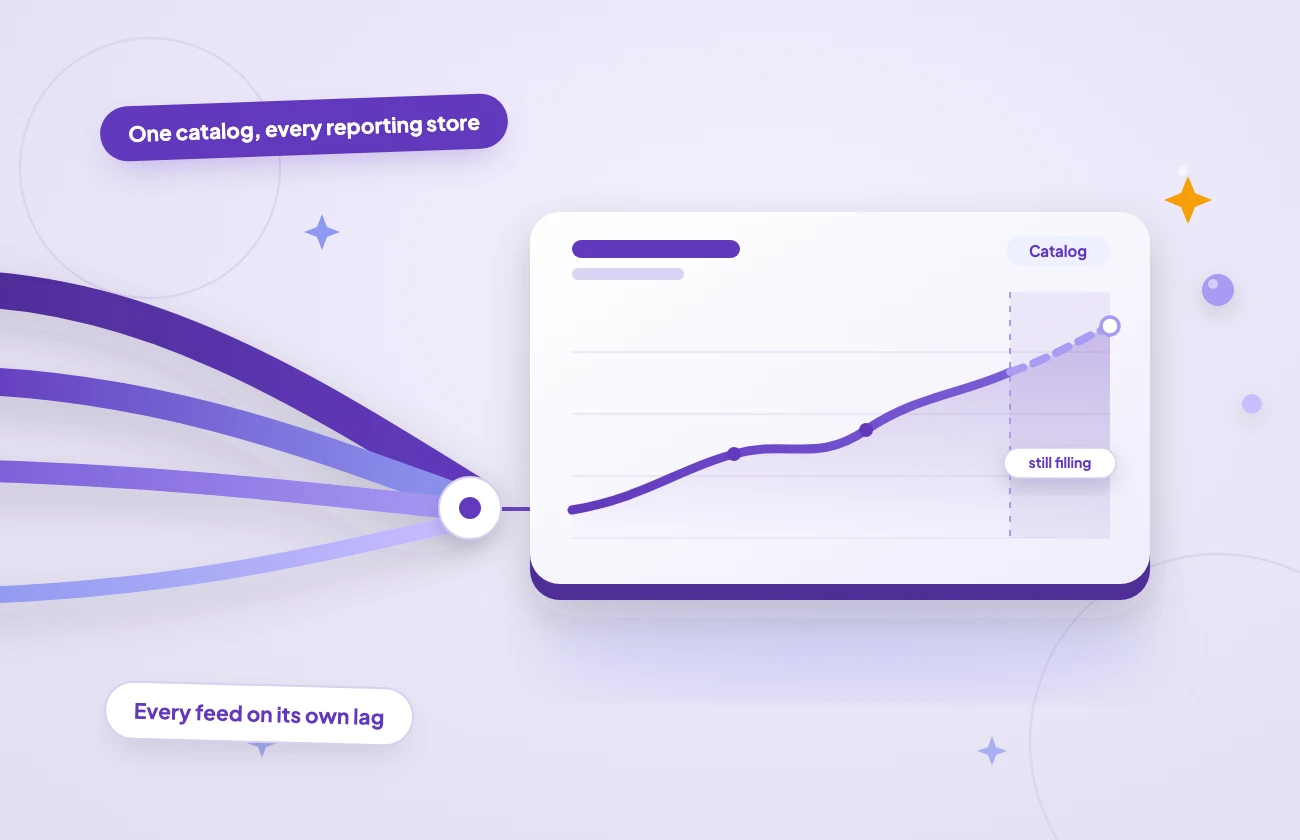
A track picks up on Deezer over the weekend. Apple Music’s editorial team adds it on Tuesday. By Thursday it is soundtracking Snapchat videos in a country nobody on your team has ever marketed in. Separate dashboards, separate logins, every feed arriving on its own lag.
LabelGrid puts the whole catalog on one screen. Spotify, Apple Music, Amazon Music, Deezer, Audiomack, Boomplay, AWA, KuGou, KuWo, QQ Music: all of them report into the same views, scoped to your labels, with the social platforms where people actually use your music sitting next to them. Read it in the dashboard, query it from your own code, or ask your AI assistant.
COMBINED, COMPARED, OR ONE AT A TIME
One dashboard, every store that reports
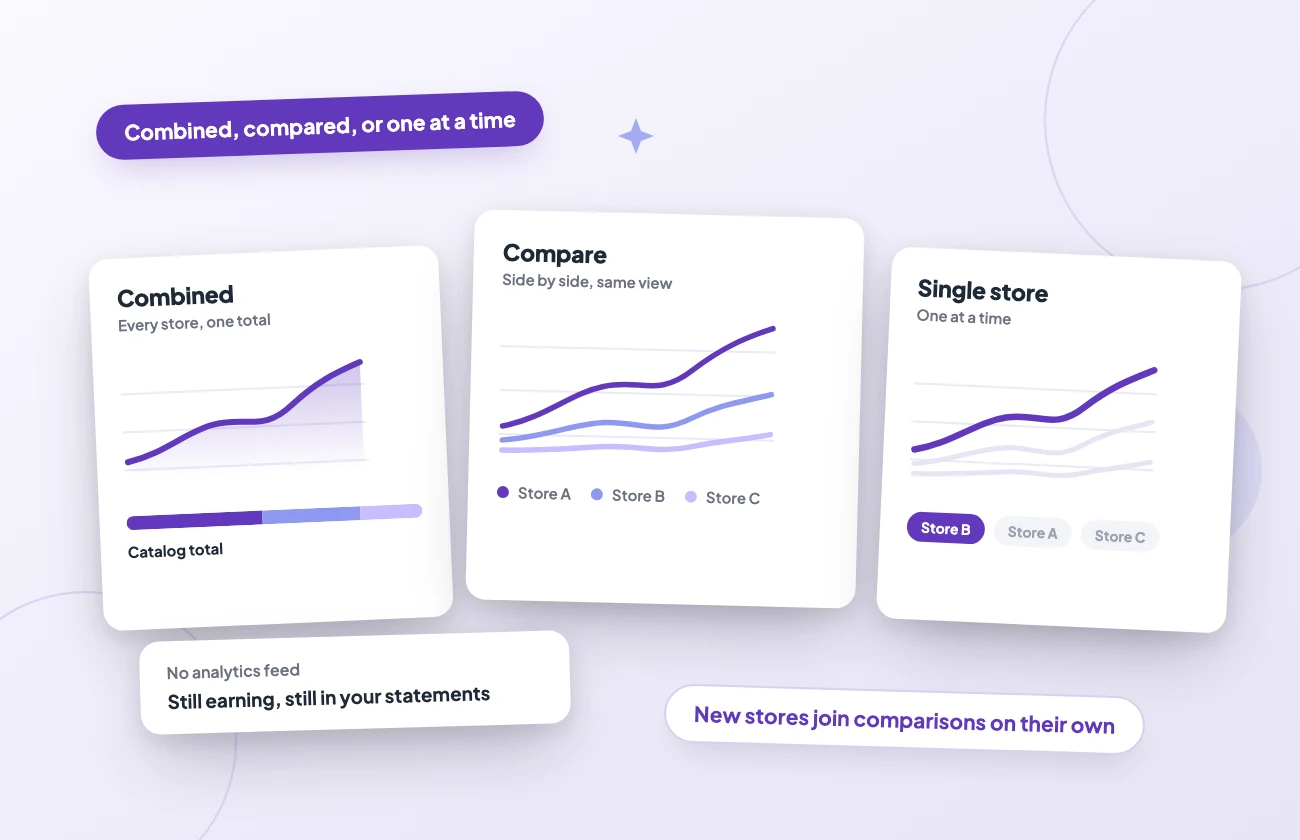
Every store on that list reports daily except KuGou, KuWo and QQ Music, which report once a week, and all of them land in the same views. Combined mode totals the catalog across every store at once. Compare mode puts them side by side, which is usually where you find out that the release doing nothing at home is doing quite well somewhere else. Single mode isolates one store when you want to work it properly. Compare-all picks up new stores on its own, so a feed added next quarter shows up in comparisons you built months ago. Amazon Music joined that way in August 2026.
LabelGrid distributes to all major DSPs, and the stores above are the ones whose analytics feeds we ingest. The rest still earn, and they still land in your royalty statements. Statements and analytics run on separate pipelines, so a store can pay you without charting here.
FORTY-SEVEN METRIC SECTIONS
Depth, not a bigger stream counter
A stream count tells you something happened. The other forty-six sections tell you what. Thirty-nine of them cover the streaming stores and eight cover social, and no store reports all of them, so the dashboard says which per metric instead of guessing.

Plays, listeners and saves
Streams come from every store on the list. Listeners come from Spotify, Apple Music, Amazon Music and Audiomack, with Spotify and Apple reporting a true de-duplicated daily count per track. Saves come from Spotify and Audiomack, and Spotify splits its saves by subscription tier. Skips and shares are Spotify signals.
Where the listening happens
Streams by country for Spotify, Deezer, Boomplay, Audiomack, Amazon Music and Apple Music, with Apple adding its own city and storefront breakdowns. AWA reports streams with no country split, because its feed carries sub-national Japanese region codes rather than countries. Nor do KuGou, KuWo or QQ Music.
Who is listening
Streams by age and gender come from Spotify and Apple Music. Listener demographics from Spotify and Deezer are a different lens on the same audience, counting people rather than plays. They cover age and gender, region, plus the free-versus-paid plan mix of your listeners.
How they listen
Spotify goes deepest here. Completion rate and skip behavior, average listen time and shuffle share. Then discovery and repeat-listener rates, the share of streams that started in a promoted context, with lyrics and canvas views alongside. Then the mechanics: device, OS, audio format, hour of day, and where the stream started, whether that was a playlist, someone’s library or a search. Deezer reports average listen time plus device and OS.
Playlists and editorial
The placements view lists the playlists a track landed in for Spotify, Apple Music and Deezer, filterable per store. Spotify rows carry the playlist name plus its owner and stream count. Apple rows name editorial playlists and the best position the track reached, sometimes with no play count attached, because a missing count means the store did not report one. Deezer rows link out to the public playlist when the id resolves.
Shazam and Apple’s own signals
Library adds, editorial playlist adds and Shazam counts, including Shazams by city and state, come from Apple Music. Apple also reports discovery cohorts, which measure how much of a window’s audience is hearing the track for the first time. Shazam is an Apple signal and Spotify has no equivalent.
NO FILLED-IN GAPS
Honest by design
It is easy to make an analytics product look complete. Spread a weekly total across seven days, print a metric the store never sent as a zero, quietly draw days that are still arriving as though they were final, and every chart fills in beautifully. LabelGrid does none of that, which means you will sometimes see a gap here instead of a number.
A metric the store does not report
When a store does not send a metric, the dashboard marks it unavailable for that platform. It never shows a zero, because zero is a real measurement and “this store does not publish this” is a different statement entirely. Amazon Music is the clearest example of why that matters: it reports streams and listeners, with a country split, and nothing else, so its skip and demographic charts read unavailable rather than flat.
Weekly stores stay weekly
KuGou, KuWo and QQ Music report once a week. Each report becomes one data point, dated to the day it covers and carrying that week’s whole total, never divided into seven invented daily figures. On a daily chart those stores show one populated date per week with space between, which is correct rather than missing, and range totals still add up.
The last few days are still filling
Every metric carries its own reported-through date and its own complete-through date, and they are not always the same day. Anything between them is still arriving, so those buckets are marked partial instead of letting a half-reported day read as a collapse. Expect the trailing edge of a chart to rise on a later view.
The privacy floor on audience detail
Demographic and geographic breakdowns are k-anonymised. Apple city breakdowns, Shazams by city and state, and listener demographics are all withheld until the audience reaches a minimum size, and a cell that falls below it is dropped outright: no “other” bucket, no rolled-up total that would let the suppressed audience be worked out backwards. A small catalog can therefore show healthy streams next to an empty demographics or city chart. That is the floor doing its job, and the space stays empty rather than getting filled with a number we invented.
What is deliberately not in here
Streaming-integrity detection stays out of customer analytics entirely, so nothing in these charts doubles as a verdict on an artist. That work lives in Stream Radar, a separate add-on with its own surface.
SOCIAL AND UGC
Your music, used outside the stores
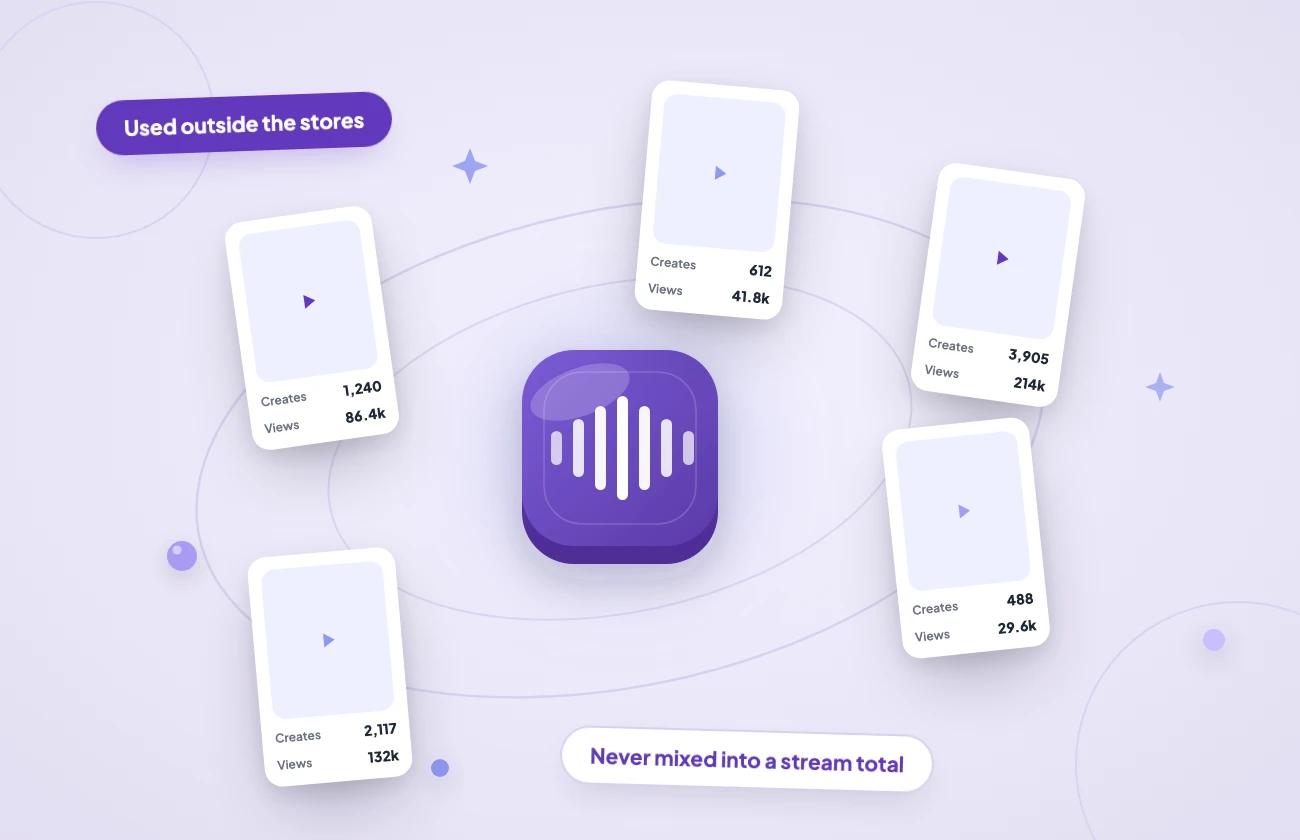
A track of yours ends up in somebody’s Snapchat video. That use never lands in a stream count, and it is exactly the side of the catalog the social view covers.
SoundCloud reports plays, average listen time, reposts, favorites, playlist adds and territories. Snapchat reports content creates, meaning the actual pieces of content made with your music, along with views and territories. The Meta apps arrive on one usage census, split per app. Instagram and Facebook report creates, views and territories, and add follower and engagement growth on the artist’s account. WhatsApp and Messenger report the same three without the growth figures. Threads reports views and reach only, because the census carries no Threads creations at all.
These run on a separate platform axis from the stores. A use, a view and a play are three different quantities, so none of them is ever added to the others and none of them is ever added to a stream total.
THE OFFICIAL MCP SERVER
Ask an AI assistant about your streaming stats
“How did the Berlin release do on Apple Music last month, and which country grew fastest?” Type that into Claude and get the answer back from your own catalog, with no query written and no export opened.
LabelGrid publishes the official MCP server for this. It is first-party, open source under the MIT licence, and it installs from npm as @labelgrid/mcp. Underneath it is a typed wrapper over the same public analytics API described below, so an assistant reads exactly what your dashboard reads and nothing more. Claude Desktop, Claude Code and Cursor all connect to it, as does any other Model Context Protocol client, and both it and the API run on a LabelGrid API plan.
It also hands the assistant the same availability matrix and the same freshness dates the dashboard reads, so a metric a store never reported comes back marked unavailable instead of blank. Amazon Music demographics are the easy example: they do not exist, and the matrix says so. An assistant that has to guess at your numbers is worse than no assistant.
THE PUBLIC ANALYTICS API
Query your catalog from your own code
Every metric above is on the public API under /api/public/analytics, scoped to your own labels, and you narrow it with the identifiers you already work in: ISRC, UPC, release or artist. The summary endpoint returns up to twelve of the forty-seven sections in one call, including the eight social sections, which filter[ugc_platform] narrows to a single platform. Fifteen standalone series endpoints cover the individual metrics on their own. Leaderboards rank your top performers, and entity filters narrow that ranking to one label, artist, release or track. Placements returns playlist rows filtered by platform.
Two things are worth building against. Ask the availability endpoint what a platform supports and it hands back the whole streaming section-by-platform matrix plus each store’s cadence in one cacheable, parameter-less call, so your integration reads the matrix instead of hardcoding assumptions that break the week a store is added; social availability arrives on any summary response that asks for a social section. And every summary response carries per-section freshness, so your own reports can mark provisional days the same way ours do.
Summary and the series endpoints accept a 400-day window, a full year plus a comparison period in a single request; leaderboards and placements run to 180 days. Scope a summary to a release and the per-track sections return a daily series for every track on it, one row per date, platform and ISRC, rather than one call per track.
COMMON QUESTIONS
Frequently Asked Questions
Start with your own numbers
Analytics, advanced set included, comes with every standard plan.