Monday morning, a label manager asks how the roster did last week. Spotify for Artists lists the roster artist by artist, but Spotify says it cannot show an overview of the entire catalog. Apple Music for Artists runs on a different clock. Deezer for Creators shows audience and release performance at creators.deezer.com.
That is the actual job of streaming analytics for record labels. A catalog-week number you can take into a meeting, built from stores that do not share a listener definition, a refresh time, or an artist login.
Spotify counts a stream when a listener plays a song for at least 30 seconds, timestamps everything in UTC, and refreshes daily around 8 PM UTC. Apple Music records a Play after more than 30 seconds, also in UTC, and new data takes 48 hours to appear. What follows is what each of the three actually reports, why the royalty statement will not match the chart, and how to add them without filling empty days with invented numbers.
Three artist portals cannot answer a roster question
Each store built its dashboard around the artist, because that is what a listener sees. A label does not work that way: the week’s catalog total, summed across every artist and every store, still has nowhere to live.
The headline metrics disagree even when you do log in everywhere. Spotify’s listeners are unique people who streamed audio or video in the period you pick. Apple publishes Average Daily Listeners, the mean of daily unique listeners inside whatever window you selected, which is a rate, not a headcount. Followers are a third object: people who follow the artist profile. Deezer for Creators reports its own count of unique listeners. Export all three and the columns look like the same word.
The chart and the statement are different files
A counted play is not a payable line. Spotify for Artists and Apple Music for Artists are operational trend feeds. Royalty statements come later. They are built from the store’s DDEX Digital Sales Report, the usage file a store sends to rights owners so onward payments can be made. Dashboard counts stay provisional. The statement, once it lands, is the reconciled set used for payment. When they arrive depends on each store’s own reporting schedule.
Recordings are keyed by ISRC, which identifies the sound recording, not the composition. One play can produce a recording-rights line and a separate work-rights line. If you are reconciling earnings, use royalty accounting, not the analytics chart. LabelGrid keeps that split on purpose: analytics for what moved, statements for what is owed.
What Spotify, Apple Music and Deezer actually report
Once a distributor ingests the three feeds, the honest move is to show a blank where a store never sent a metric, rather than a zero. This is what LabelGrid currently surfaces for those three, next to the Spotify distribution path the same catalog already uses.
| Metric | Spotify | Apple Music | Deezer |
|---|---|---|---|
| Streams / Plays | Yes, 30 seconds or more | Yes, more than 30 seconds, including Apple Music radio | Yes |
| Listeners | Daily unique listeners per track, added across days | Daily unique listeners per track, added across days | Not reported |
| Saves | Yes | Library adds (a different event) | Not reported |
| Source of streams | Where plays came from (playlists, library, search and more) | Not reported | Not reported |
| Shazam | Not reported | Yes, including by city and state | Not reported |
| Streams by country | Yes | Yes | Yes |
| Age / gender of streams | Yes | Yes | Not reported |
| Listener demographics | Yes | Not this lens | Yes |
| Devices / OS | Yes | Not reported | Device and OS |
| Playlist placements | Name, owner, streams | Editorial name and position; plays often not reported | Rows with a public playlist link where it resolves |
Spotify is the only one of the three that splits plays by where they came from. Apple’s distinctive signal is Shazam, plus library adds and editorial playlist position. Deezer is the leanest of the three: no listener total, no saves, no Shazam, no source mix.
Do not average those columns. A Shazam is not a save. An Apple editorial row with no play count is not a playlist that did zero. Combined adds a metric up across the stores that report it and notes which stores do not, so a metric only one store reports is still that store’s number.
See the roster in one dashboard
Combined, compare, or single-store views across Spotify, Apple Music, Deezer and every store that reports a feed. 7-day free trial.
See PlansAdd the stores without inventing days
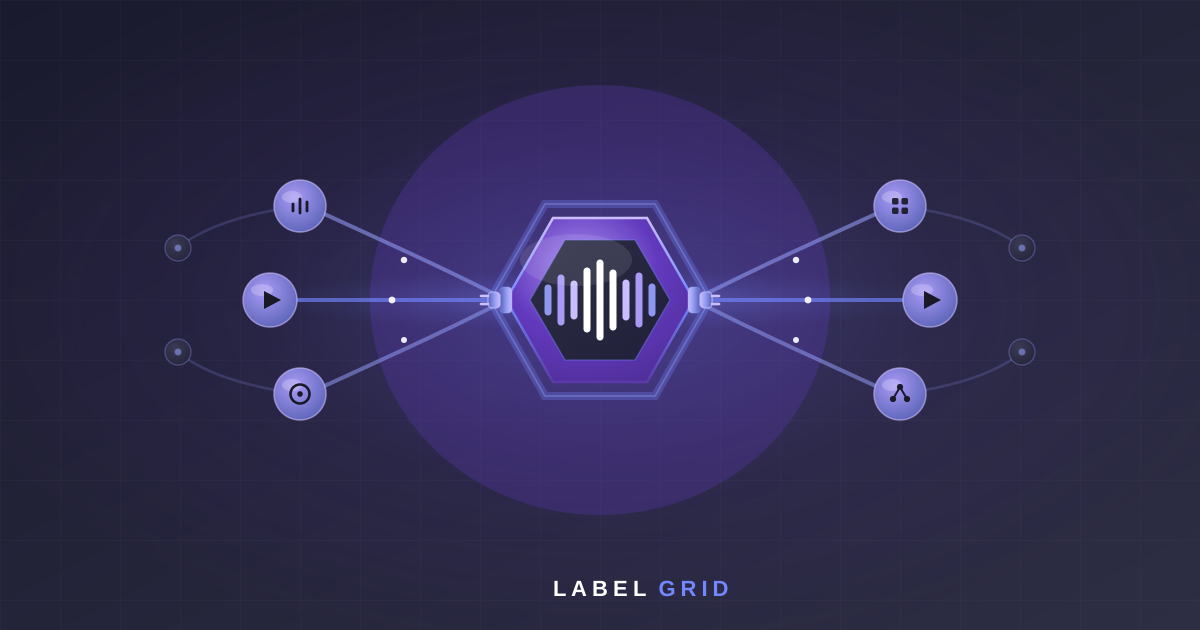
LabelGrid’s streaming analytics dashboard is built for the catalog, not the artist login. Filters at the top (store mode, period, scope) apply to every view. Combined is the default: one total across every store that reports data for your catalog, with a note on charts that mix stores so a smaller number never silently means one store only. Compare plots two or more stores as separate series; All stores is allowed, and it picks up stores added later. Single store is the whole dashboard pointed at Spotify, or Apple Music, or Deezer.
Ten stores currently report a streaming feed: Spotify, Apple Music, Deezer, Audiomack, Boomplay, AWA, Amazon Music, Kugou, Kuwo, and QQ Music. The first seven land daily. Kugou, Kuwo, and QQ Music land weekly: one point per track, the whole week sitting on a single date. LabelGrid does not invent seven daily values from that point. Dots with gaps on a daily chart. Correct, not missing. Distribution still reaches more stores than this list; activity on the rest shows up in statements, because statements and analytics are separate pipelines.
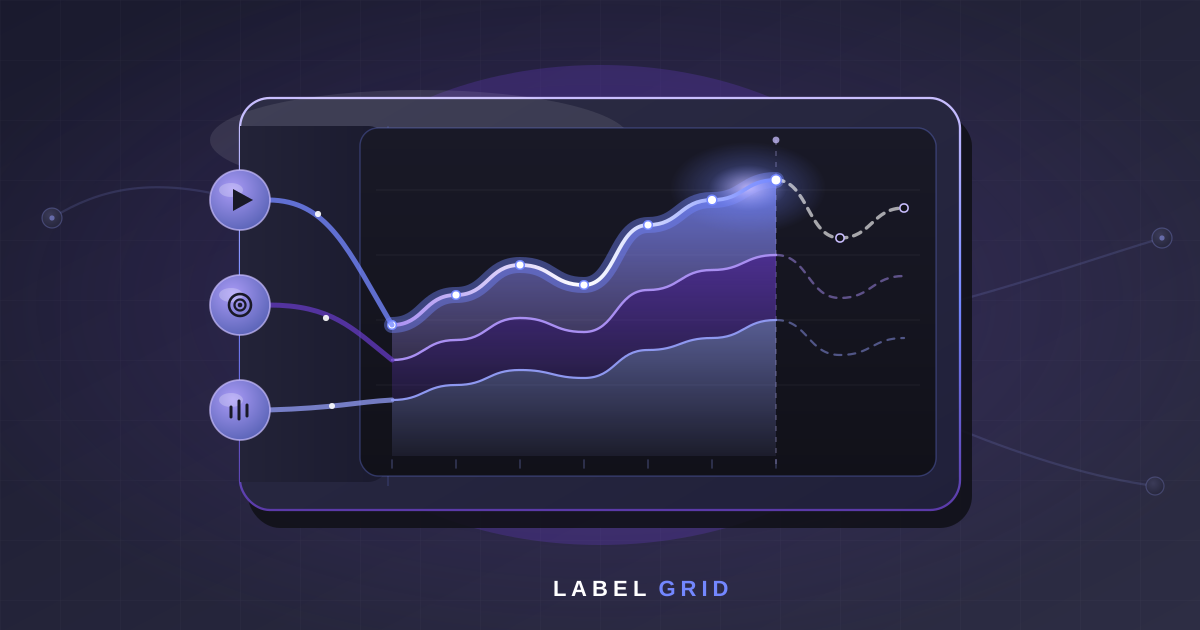
Each card carries a Reported through caption, the newest date that metric has finished. Days after that draw as a dashed tail. Major stores typically complete a day within 1 to 3 days; smaller stores can take longer. That spread is observed behaviour, not a deadline. Spotify for Artists does offer a live stream count for the first seven days of a new release, updating every two seconds. That window lives on Spotify’s site. It is not how LabelGrid, or Apple, or Deezer, publishes a catalog week.
Two more traps that look like missing data. Listener totals over a month add each day’s listeners. Play on ten days, count ten. Read the day-to-day trend, not the sum as unique fans. Demographic and city charts drop cells below a privacy floor, with no leftover bucket, so a small catalog can show healthy streams and an empty age chart. Social activity (SoundCloud, Instagram, Snapchat, and the rest of that tab) is a different family of numbers and is never folded into DSP streams.
Apple Music analytics: two questions labels ask
Why does Apple Music show audience data for fewer countries than Spotify?
Usually because Apple holds back small markets, not because of a gap in delivery. Apple reports streams by country, but for a market below its own privacy threshold it sends zero streams and zero listeners instead of the real figures. LabelGrid shows what Apple sends and does not estimate the markets Apple withheld. LabelGrid also applies its own floor to demographic and city charts: any cell below a minimum audience is dropped, with no “other” bucket.
Which distributors include Apple Music analytics?
Apple Music for Artists is Apple’s own dashboard. The artist or the artist’s manager claims the artist page with Apple once the music has been live on Apple Music for at least five business days. LabelGrid ingests Apple Music daily and shows streams, listeners, streams by country, the age and gender of streams, library adds, editorial playlist adds and Shazams, including by city. Analytics is included on every plan.
A Monday pass on the catalog
Open Analytics, leave Combined on, set the last 7 days, Auto granularity. Performance answers which release or track moved. Ignore the dashed tail until Reported through catches up. If Tuesday’s meeting is about one campaign, switch Compare to Spotify, Apple Music, and Deezer and look at that release only. A Spotify spike with a flat Apple line is a different conversation from a lift that shows up on all three.
Discovery is the placements card: editorial and user playlists, stations, charts, with a store filter limited to Spotify, Apple Music, and Deezer. Use Single store when the question is Spotify-specific (where plays came from) or Apple-specific (Shazam, editorial position). Those metrics do not exist on the other two, so Combined has nothing honest to add.
Top performers ranks releases, tracks, or artists for the same filters. It is the fastest way to see whether last week was one single or a spread. Then stop. The statement will arrive on its own schedule, and it will not match this chart, which is the point of having both.
Frequently Asked Questions
Why do Spotify for Artists numbers not match my royalty statement?
They come from different files. Spotify for Artists is an operational trend feed that refreshes daily. Royalty statements come from a separate DDEX Digital Sales Report cycle, which is the reconciled usage used for payment. LabelGrid keeps the same split: analytics for trends, statements for the money.
Can I see Spotify, Apple Music and Deezer analytics in one dashboard?
Yes. LabelGrid Analytics defaults to Combined mode, which totals every store that reports a feed for your catalog. Compare places Spotify, Apple Music, Deezer and the rest as separate series. Single store focuses the whole dashboard on one of them. Analytics is included on every plan.
Why do the last two days of streams look low?
Major stores typically complete a day within 1 to 3 days, and a feed can deliver part of a day before the rest. Each card shows a Reported through date. Days after that are drawn as a dashed, provisional tail that can still rise. A trailing dip is usually a day that has not finished reporting, not a collapse in listening.
Do Apple Music plays and Spotify streams mean the same thing?
They are not interchangeable totals. Spotify counts a stream at 30 seconds or more and includes music videos in all-time figures. Apple records a Play after more than 30 seconds and includes plays from Apple Music radio stations. Each dashboard also timestamps in UTC, so an evening local release can miss that calendar day.
Which stores show playlist placements?
Spotify, Apple Music and Deezer. Spotify rows carry playlist name, owner and stream counts. Apple Music editorial rows show the track’s best position and often no play count, which LabelGrid marks as not reported rather than zero. Deezer rows link to the public playlist where that URL resolves.
Why does Apple Music show audience data for fewer countries than Spotify?
Usually Apple’s own privacy threshold. Apple reports streams by country, but a market below that threshold arrives with zero streams and zero listeners, and LabelGrid shows what Apple sends rather than estimating it. Separately, LabelGrid drops demographic and city cells below a minimum audience, with no “other” bucket.
Which distributors include Apple Music analytics?
Apple Music for Artists is Apple’s own dashboard, which the artist or their manager claims once the music has been live on Apple Music for at least five business days. LabelGrid ingests Apple Music daily, with streams, listeners, country, demographics (age and gender), library adds, editorial playlist adds and Shazams, on every plan.
Getting Started
Sign in at app.labelgrid.com and open Analytics. Performance is the catalog week. Leave Combined on, pick the last 7 days, and read the Reported through caption before you treat a dashed day as a drop. The store-mode and lag notes live in the Analytics help article. Plans, including the 7-day trial, are on pricing. If you are choosing infrastructure for a multi-artist catalog, start from music distribution for record labels.